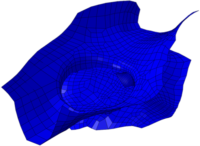
Advancing Science and Simulation
Our research group seeks to advance the science of computational models and simulations for innovation and as evidence for medical device regulatory requirements and [...]
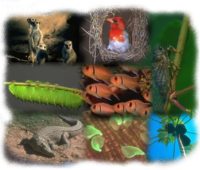
Communicating Biologically-Inspired Science
Our research group is collecting empirical data to advance biologically-inspired design, biomimicry, biomimetics, biom* --- with a scientific attitude. Specifically, we are engaging in [...]
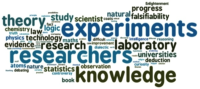
Philosophical Attitudes About Science
Do you have a scientific attitude? What does it mean to think like a scientist? We all have beliefs about the world that affect [...]


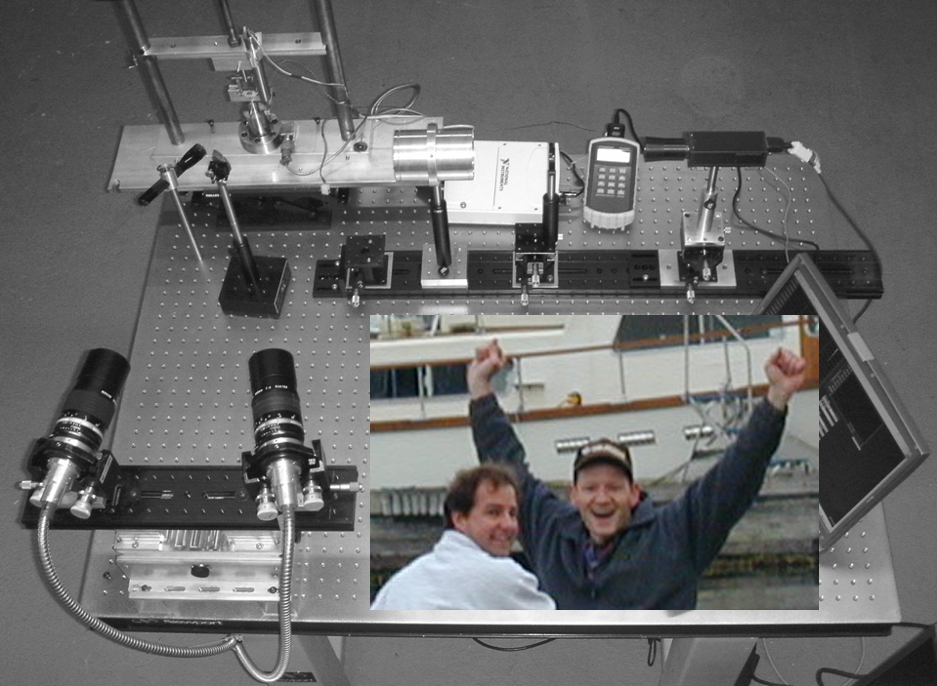
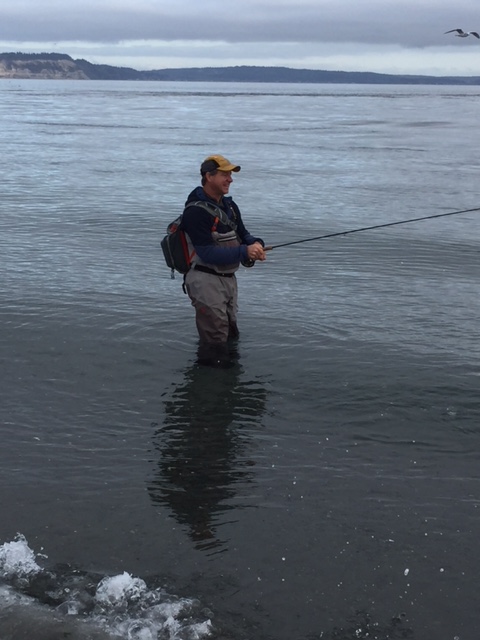
Salt Water Fly Fishing
Tides, bait and fishing are in my blood from growing up in the low country waters of Georgia and South Carolina. Calibogue and Wassaw [...]