 A typical SN curve identifies the 50% fracture rate for a given level of loading. But even if the fractures were not consequential, it would be difficult to accept a 50% fracture rate for implanted devices.
We need to do statistical analysis of the data from a fatigue test and determine what the limit load would be, at say a 5% fracture rate. Such analysis is readily available when you employ an optimal sampling technique to determine the load levels during a fatigue experiment. Furthermore, D-optimality testing maximizes the value of your testing investment by identifying test levels that will reveal the most information.
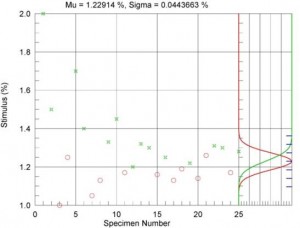
The plot on the left demonstrates how effective optimal sampling can be. Red circles indicate samples that survived 1M cycles and green crosses denote samples that fractured. After about the 10th specimen the algorithm settles into a narrow band converging on an estimate of the 50% fracture level and the associated standard deviation. The algorithm finds the median fatigue value accurately regardless of the initial conditions!
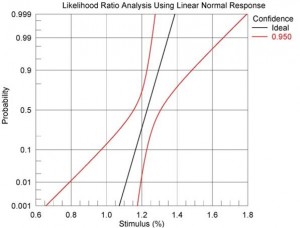
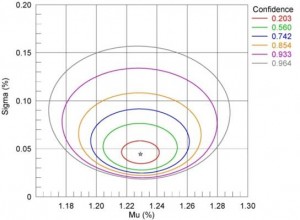
Another way to look at the data is the plot on the left below, which shows the relationship between the estimate and standard deviation for a specified confidence. A likelihood ratio analysis plot for this data is shown in the figure on the right below for a confidence of 95%. From this plot we would expect a 1% fracture rate for a loading of +/-0.8%.
The D-optimal approach to generating SN data is particularly effective when submitting data to the FDA when used for testing coupon or surrogate test samples. Move faster with expert product development resources!


